
Zoom 0

Zoom 1
Zoom 2
By Michal Guerquin and Zach Frazier
February 2005 (updated in April, June and July 2005)
Google Maps renders maps by stiching small images together. We seek to discover the storage capacity of such an image repository.
For this task, we capture and examine screen shots of Google Maps in action. Used in this analysis is a tool called Art Directors Toolkit (comes bundled with Mac OS X) which offers an overlay desktop ruler image for measuring pixel distances onscreen. This is what appears in the screenshots.
We first seek to discover the scaling factors used at each of the fifteen zoom steps.
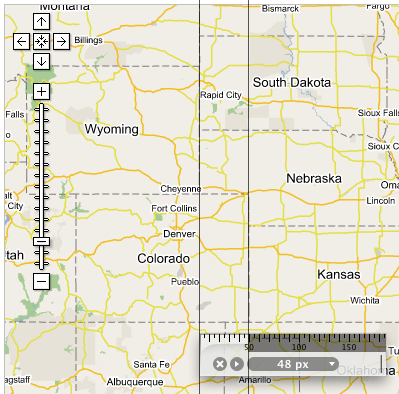
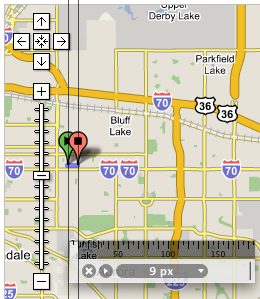
In Zoom levels 0 to 6, we measure the pixel length between the northeast corner of Colorado and the southeast corner of Wyoming. This distance is clearly marked on the map as a horizontal line, which makes measuring it easy.
For zoom levels 0, 1, and 2, the distance is 12, 24 and 48 pixels.
Zoom 0 |
Zoom 1 |
Zoom 2 |
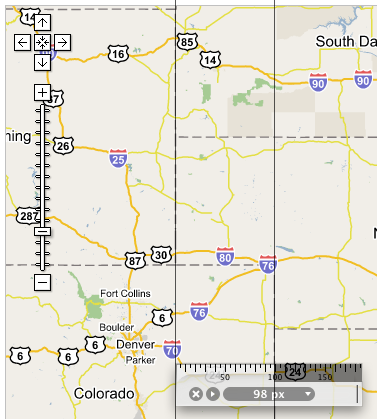
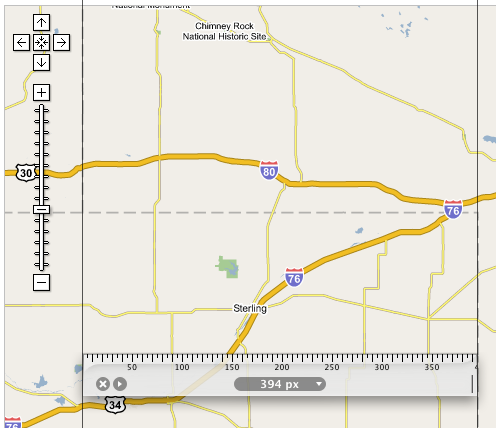
For zoom level 3, 4, and 5, the distance is 98, 196, 394 pixels.
 Zoom 3 |
 Zoom 4 |
 Zoom 5 |
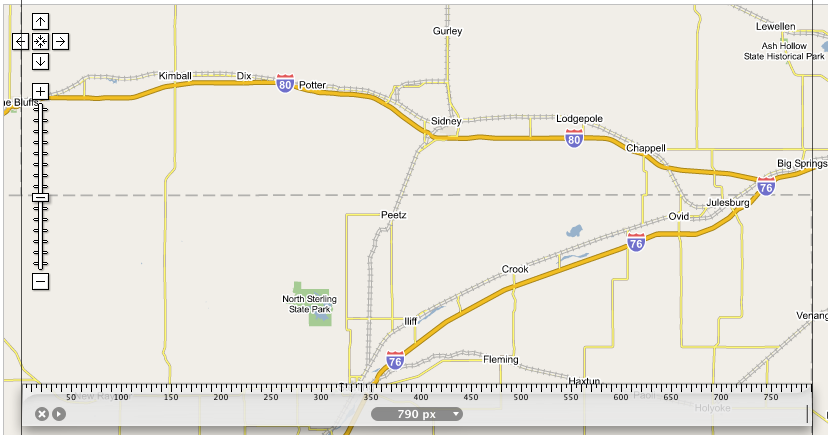
For zoom level 6 the distance is 790 pixels. Zoom level 7 was skipped1.
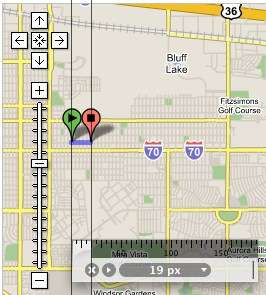
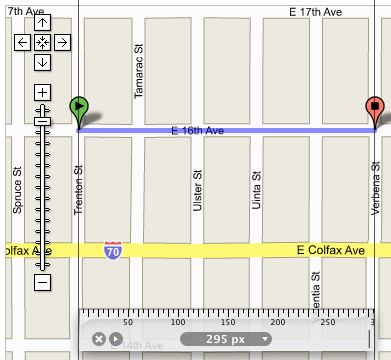
In zoom levels 8 to 14, we measure the pixel length of the path from the intersection of Trenton St and E 16th Ave to the intersection of Verbena St and E 16th Ave in Denver Colorado (which is the closest metropolitan area to our previous locations).
For zoom level 8 the distance is 9 pixels.
 Zoom 6 |
(Skipped) Zoom 7 |
 Zoom 8 |
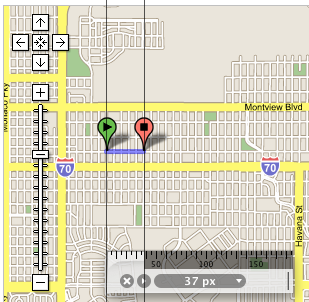
For zoom level 9, 10, and 11, the distance is 19, 37 and 74 pixels.
 Zoom 9 |
 Zoom 10 |
Zoom 11 |
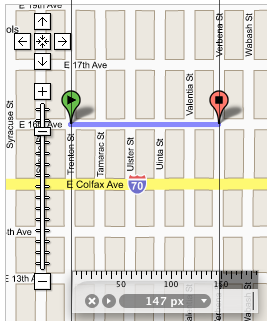
For zoom level 12, 13, and 14, the distance is 147, 295 and 590 pixels.
 Zoom 12 |
 Zoom 13 |
 Zoom 14 |
Putting it all together, we have:
| Zoom | Colorado/Wyoming border length | Previous/This ratio |
| 0 | 12 | n/a |
| 1 | 24 | 2.000 |
| 2 | 48 | 2.000 |
| 3 | 98 | 2.042 |
| 4 | 196 | 2.000 |
| 5 | 394 | 2.001 |
| 6 | 790 | 2.005 |
and
| Zoom | Street length | Previous/This ratio |
| 8 | 8 | n/a |
| 9 | 19 | 2.375 |
| 10 | 37 | 1.947 |
| 11 | 74 | 2.000 |
| 12 | 147 | 1.986 |
| 13 | 295 | 2.006 |
| 14 | 590 | 2.000 |
Graphically, this data looks as follows.
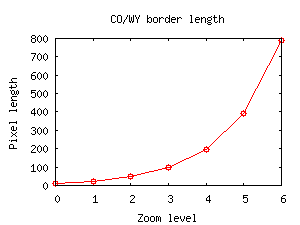
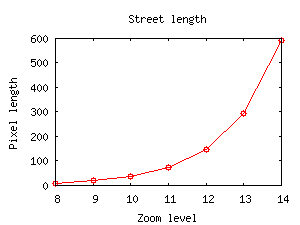
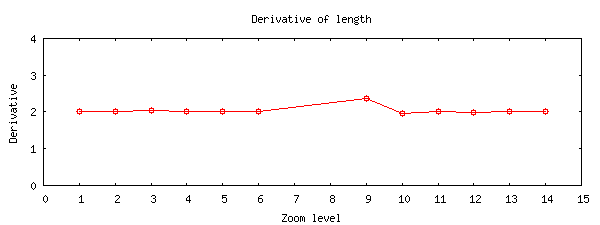
So, we can be fairly certain that the scale doubles with every increment of the zoom bar.
Using Google Maps we see that North America2 fits nicely in a 600 by 800 pixel rectangular region, amounting to 480,000 pixels.

Armed with this discovery, we proceed to estimate the pixel-area of this body at each zoom level.
| Zoom | Scale | Width | Height | Area |
| 0 | 1 | 800 | 600 | 480,000 |
| 1 | 2 | 1600 | 1200 | 1,920,000 |
| 2 | 4 | 3200 | 2400 | 7,680,000 |
| 3 | 8 | 6400 | 4800 | 30,720,000 |
| 4 | 16 | 12,800 | 9600 | 122,880,000 |
| 5 | 32 | 25,600 | 19,200 | 491,520,000 |
| 6 | 64 | 51,200 | 38,400 | 1,966,080,000 |
| 7 | 128 | 102,400 | 76,800 | 7,864,320,000 |
| 8 | 256 | 204,800 | 153,600 | 31,457,280,000 |
| 9 | 512 | 409,600 | 307,200 | 125,829,120,000 |
| 10 | 1024 | 819,200 | 614,400 | 503,316,480,000 |
| 11 | 2048 | 1,638,400 | 1,228,800 | 2,013,265,920,000 |
| 12 | 4096 | 3,276,800 | 2,457,600 | 8,053,063,680,000 |
| 13 | 8192 | 6,553,600 | 4,915,200 | 32,212,254,720,000 |
| 14 | 16384 | 13,107,200 | 9,830,400 | 128,849,018,880,000 |
If we add up all the areas, we find that 171,798,691,680,000 (171 trillion) pixels are needed to store all the bitmap information. Since all maps are made up of small 128x128 tiles, one can venture to guess that there are 171,798,691,680,000/(128*128) = 10,485,759,990 (10.5 billion) potential tile files.
Looking at the above map's color histogram, we find that about 60% it is water. Assuming that Google is keen in observing such statistics, we can guess that the a single tile is used for all the water regions. There are also lots of regions (like tundra, deserts, or forests) on the map where uniformly colored tiles can be used. Computing this accurately is more difficult, but we will say it amounts to 10% of the data.
So, only 30-40% of the tiles have unique data on them. This reduces the amount of data to 50-70 trillion raw data pixels stored in 3 to 4 billion image files. Assuming a modest 1 byte per 6 pixels compression ratio (for LZW-encoded GIF format images), the storage required might be 50-70 trillion pixels * (1 byte/6 pixels) = 8 to 11 TB.
Google Maps UK was recently introduced, as was mention of Google Earth. This provides further evidence of a lofty goal to create a world atlas. So, this puny analysis (as it is compared to the worlds topology and architectural landmark data necessary for Google Earth) ought make an attempt at covering the whole earth with tiles. To do this, we must learn more about the world. The CIA Factbook provides just what we need.
To wrap the world requires 510 million km2 of surface. Of this amount, only 29.2%, or 147 million km2, is land. North America's surface area is about 21.4 million km2 (9.9 for Canada, 9.6 for US, and 1.9 for Mexico) or 13.6% of the worlds land surface area.
We concluded from our analysis that covering North America requires somewhere between 3 and 4 billion distinct tiles to be fully described. Now we know that this is only 13.6% of the tiles necessary to describe the world's land tiles. So, anywhere from 22 to 30 billion distinct tiles ought to cover the world's surface area. Using the compression ratio described above, the world's tiles amount to 61 to 85 TB.
Yes, it seems comical to attempt such a calculation where every step of the way requires an approximation. That's why in the end we end up with a such a wide chasm of error. And, of course, this rough analysis does not cover area distortion introduced by mapping the globe's points onto a two dimensional surface. But, there you have it!
Tiles for large portions of rural Canada are omitted at high zoom levels. For example, this remote location in British Columbia has no tiles for the highest zoom level.
I've been contacted regarding this page with observations. Here I'll share them.
Daniel Drucker wrote explaining that GIS data is stored in a vectorized format ("street starts at this x,y coordinate and ends at this other x,y coordinate", "this lake is a blue polygon with these points...", etc.) which is much more efficient for storage than bitmaps. Images can be rendered from such a description quite quickly.
In response to Daniel: This page is an exercise at exploring the grandiose nature of Google's endeavors. We wanted to entertain the question of how much space one would need to store all the images. It might be the case that only some subset of the US is rendered into bitmap images, while the rest happens on-demand with some pre-emptive generation. But, we are inclined to believe that massive disk storage is cheaper than fast computers.
Added to this mix is the addition of satellite imagery, which cannot be generated from some vectorized form -- it's a bunch of photographs stitched together. Now that is stored somewhere, and I think that it is stored in the same way that the non-satellite tile images are stored.
The analysis has been expanded to cover the potential of the entire world.
Tedman Eng wrote suggesting that the tiles might not be precalculated exhaustively, but created on-demand and stored in a permanent cache for future hits. This way, tiles that would never have been requested (like those used in the middle of the atlantic) are never computed or stored, and those that are requested (like, of metropolitan areas) will likely be already cached by the time someone gets to them.
This does sound like a reasonable middle ground between exhaustive pre-generation and strict on-demand generation. A similar technique could be applied to satellite imagery, where scaled versions of images are generated on-demand and stored in this cache. Of course, as Tedman says, this is all just a conjecture :)
Zach and I had a chance to speak with Lars Rasmussen, the lead engineer behind Google Maps, at the O'Reilly Where 2.0 conference. He admitted that the tiles are in fact precomputed, leading more credibility to this analysis.
The webpage was published as Hack 16 in the book Google Maps Hacks (O'Reilly Media).
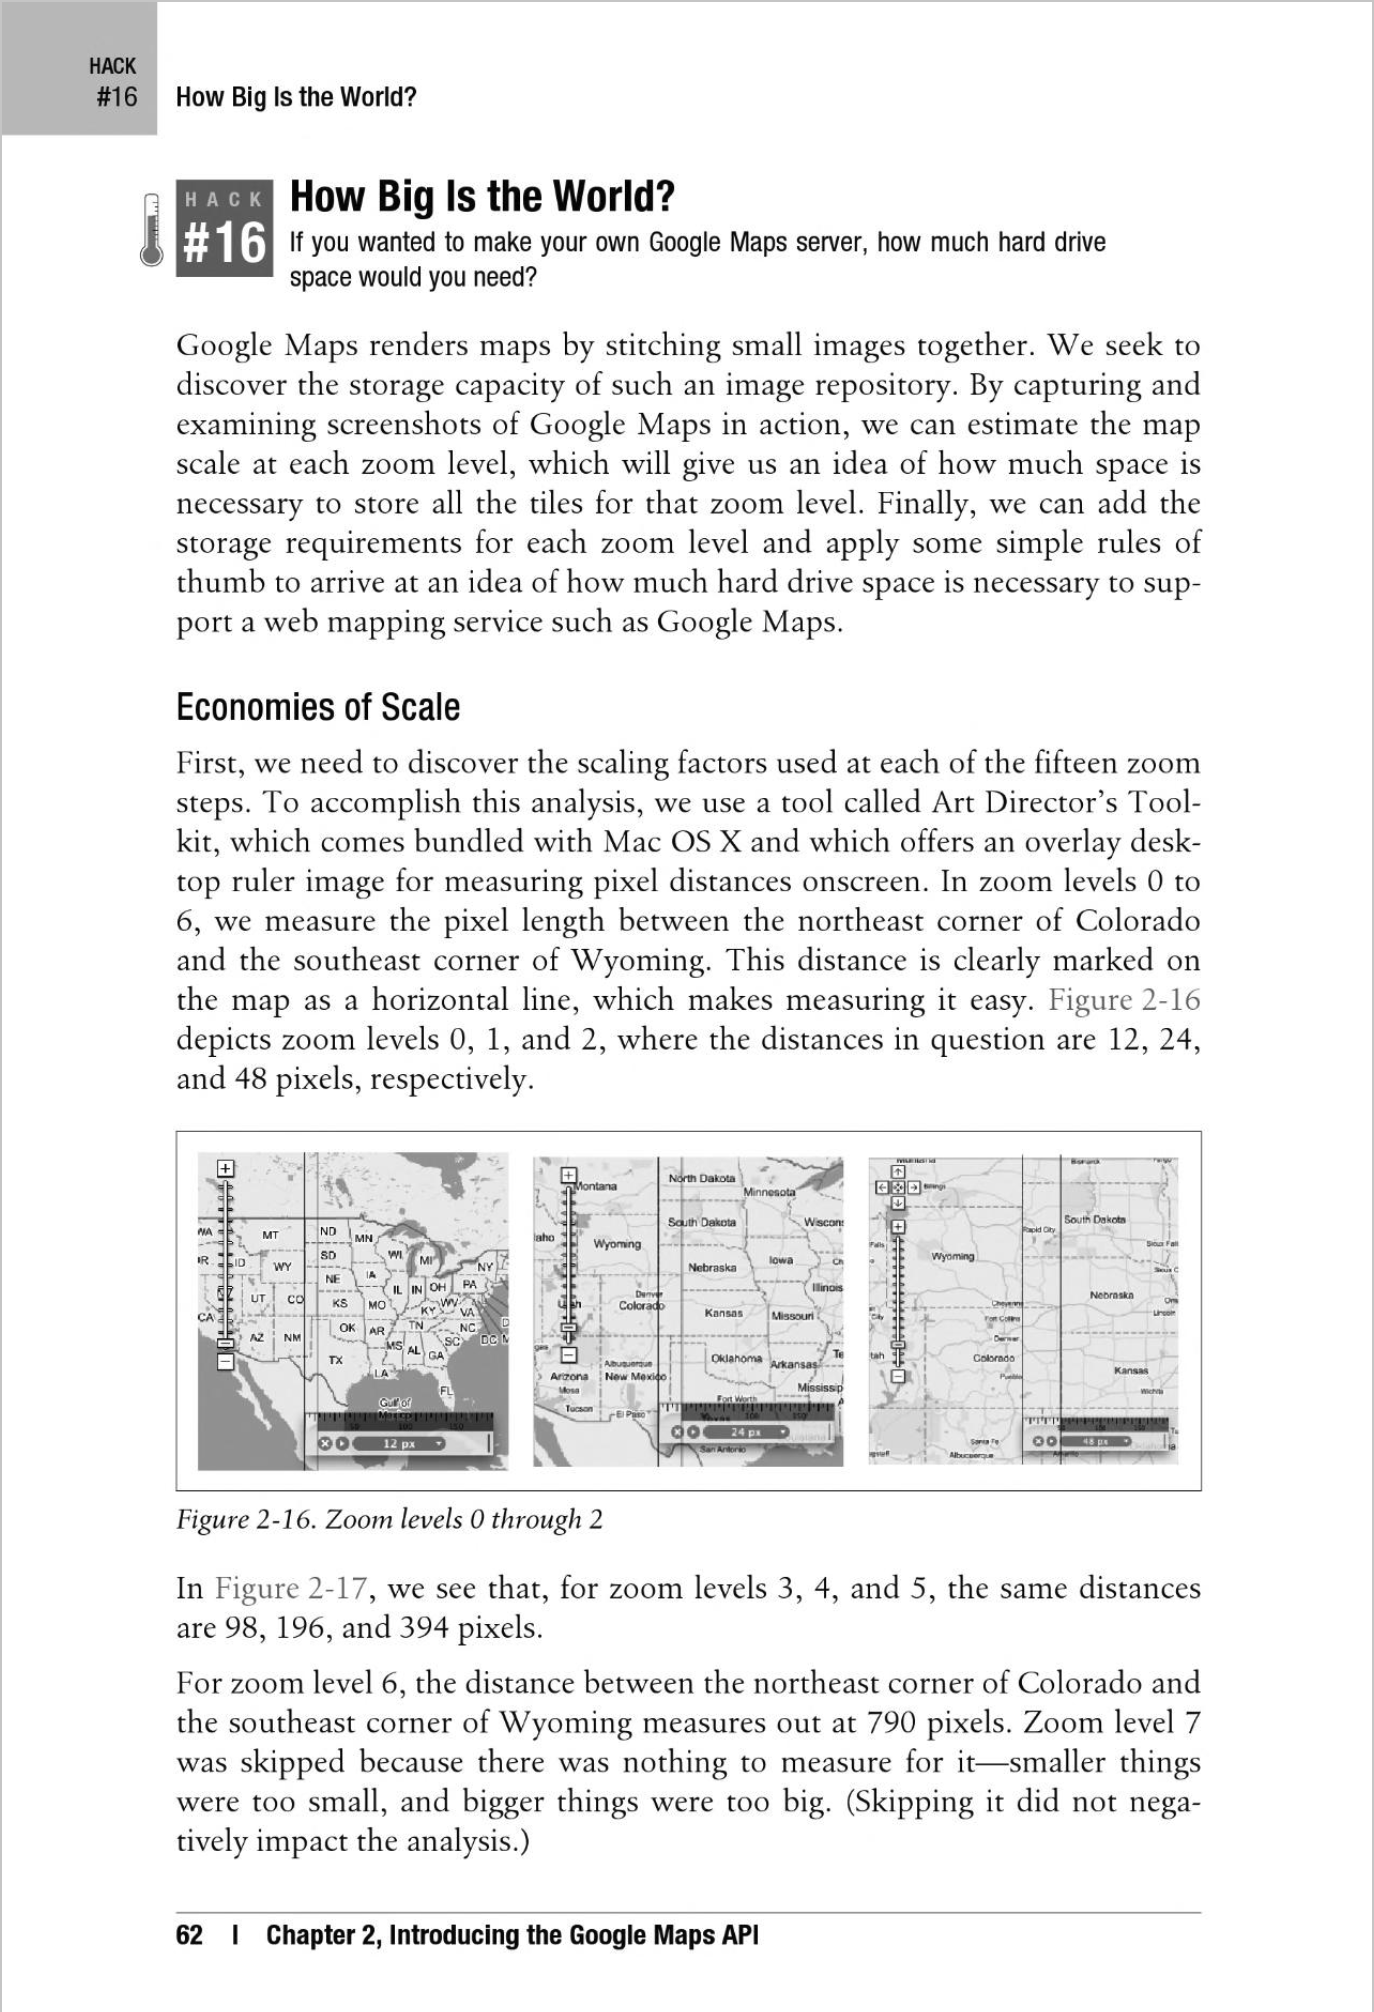
1 Zoom level 7 was skipped because there was nothing to measure for it -- smaller things were too small, and bigger things were too big. Skipping it did not negatively impact the analysis.
2 As of this writing, only North America is represented by Google Maps. It is hoped that a more accurate depiction of the world is forthcoming, but for this analysis, we have what we have.
https://michal.guerquin.com/googlemaps.html, updated 2021-11-03.